Multi-Dimensional Viewer (MDV)
Transform complex single-cell, spatial transcriptomics, proteomics, imaging, and multiomics datasets into intuitive biological insight.
A robust, open-source platform optimized for interactive multi-modal omics analysis and high-performance visualization.
Optionally integrated with ChatMDV, an advanced large language model layer that translates natural language commands directly into reproducible code and interactive visual outputs.
Analyse Complex Omics Data
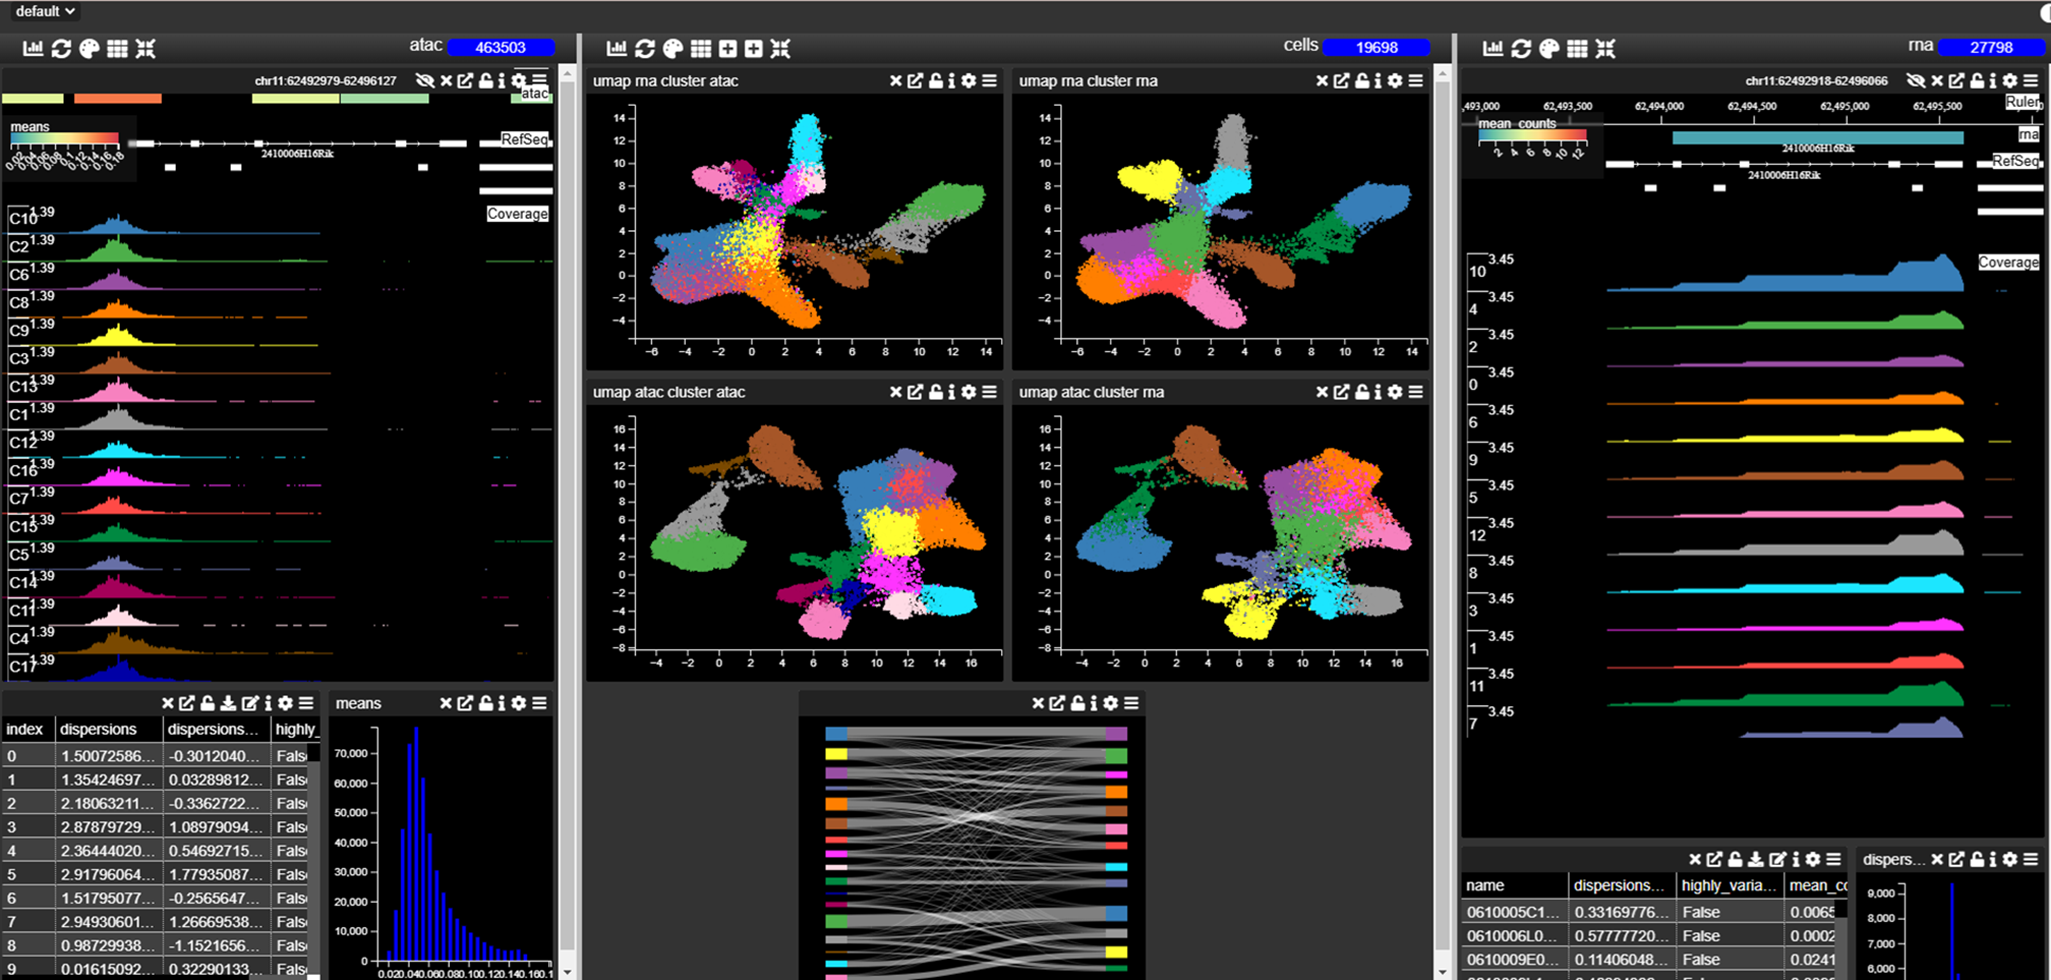
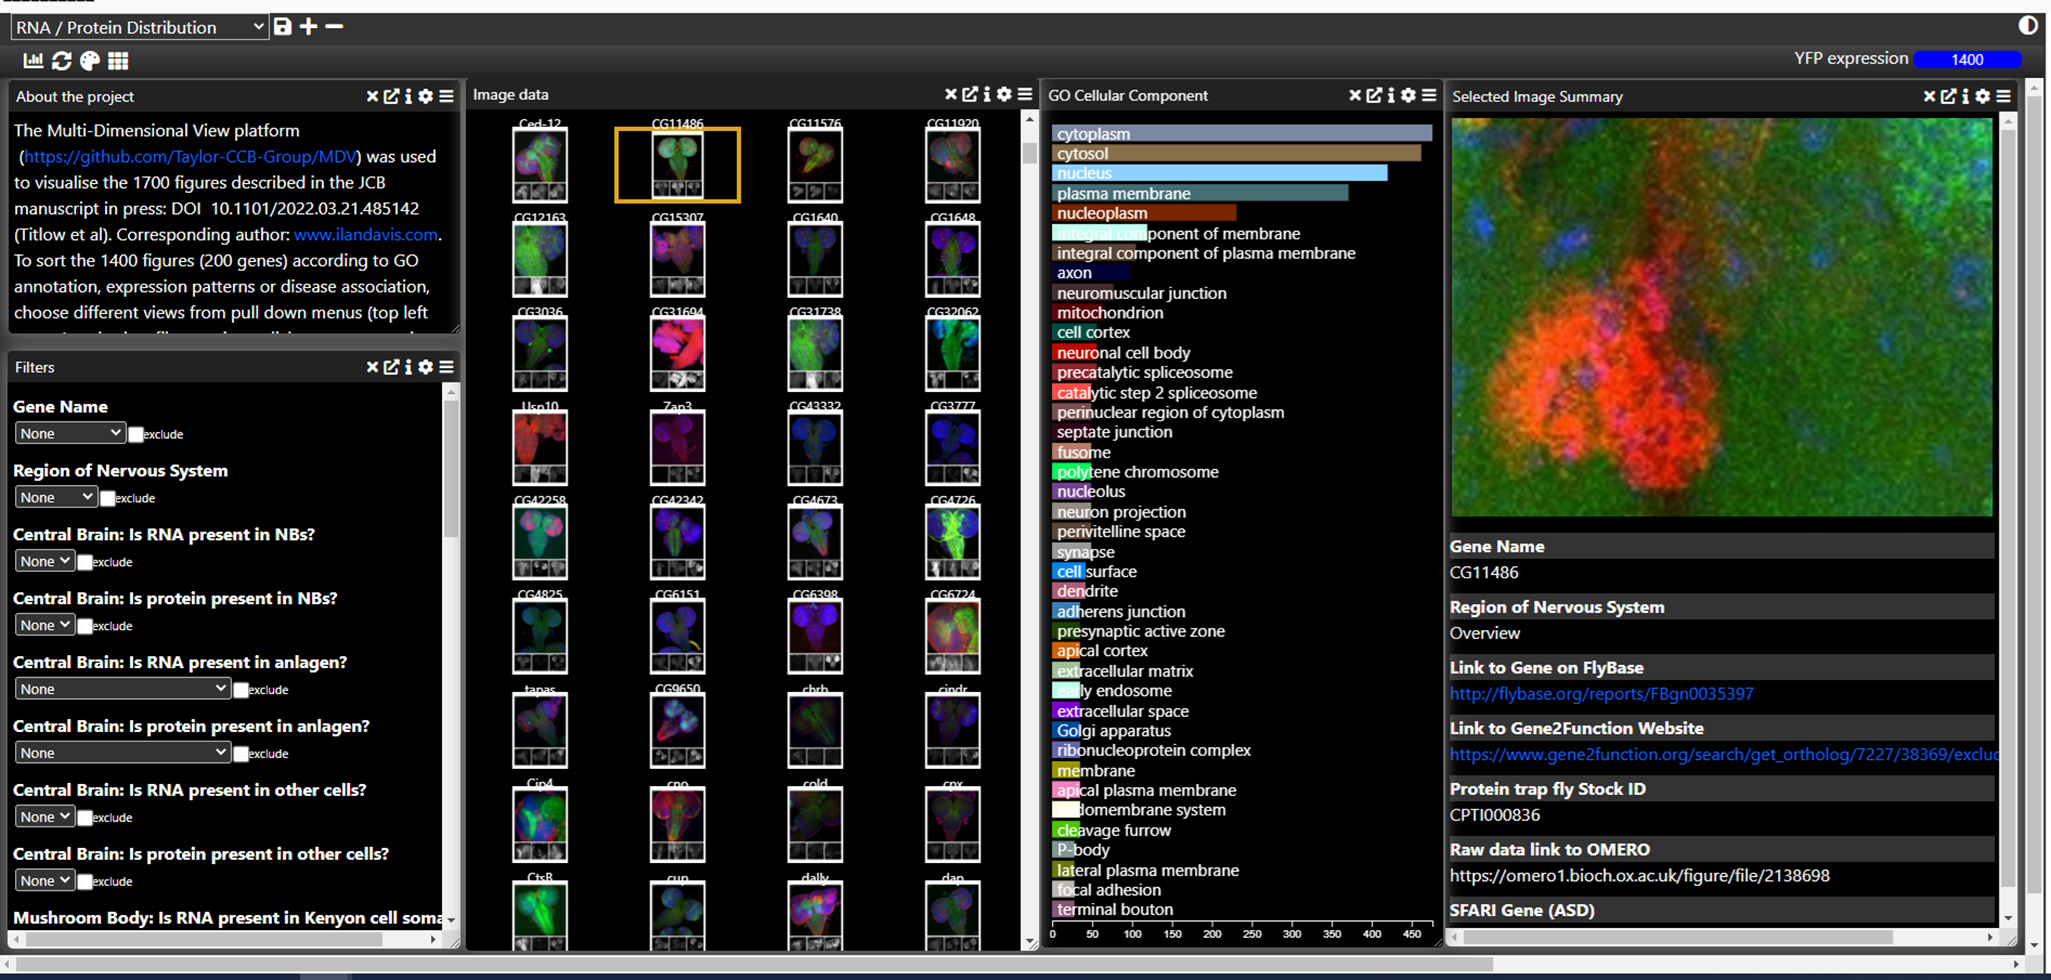
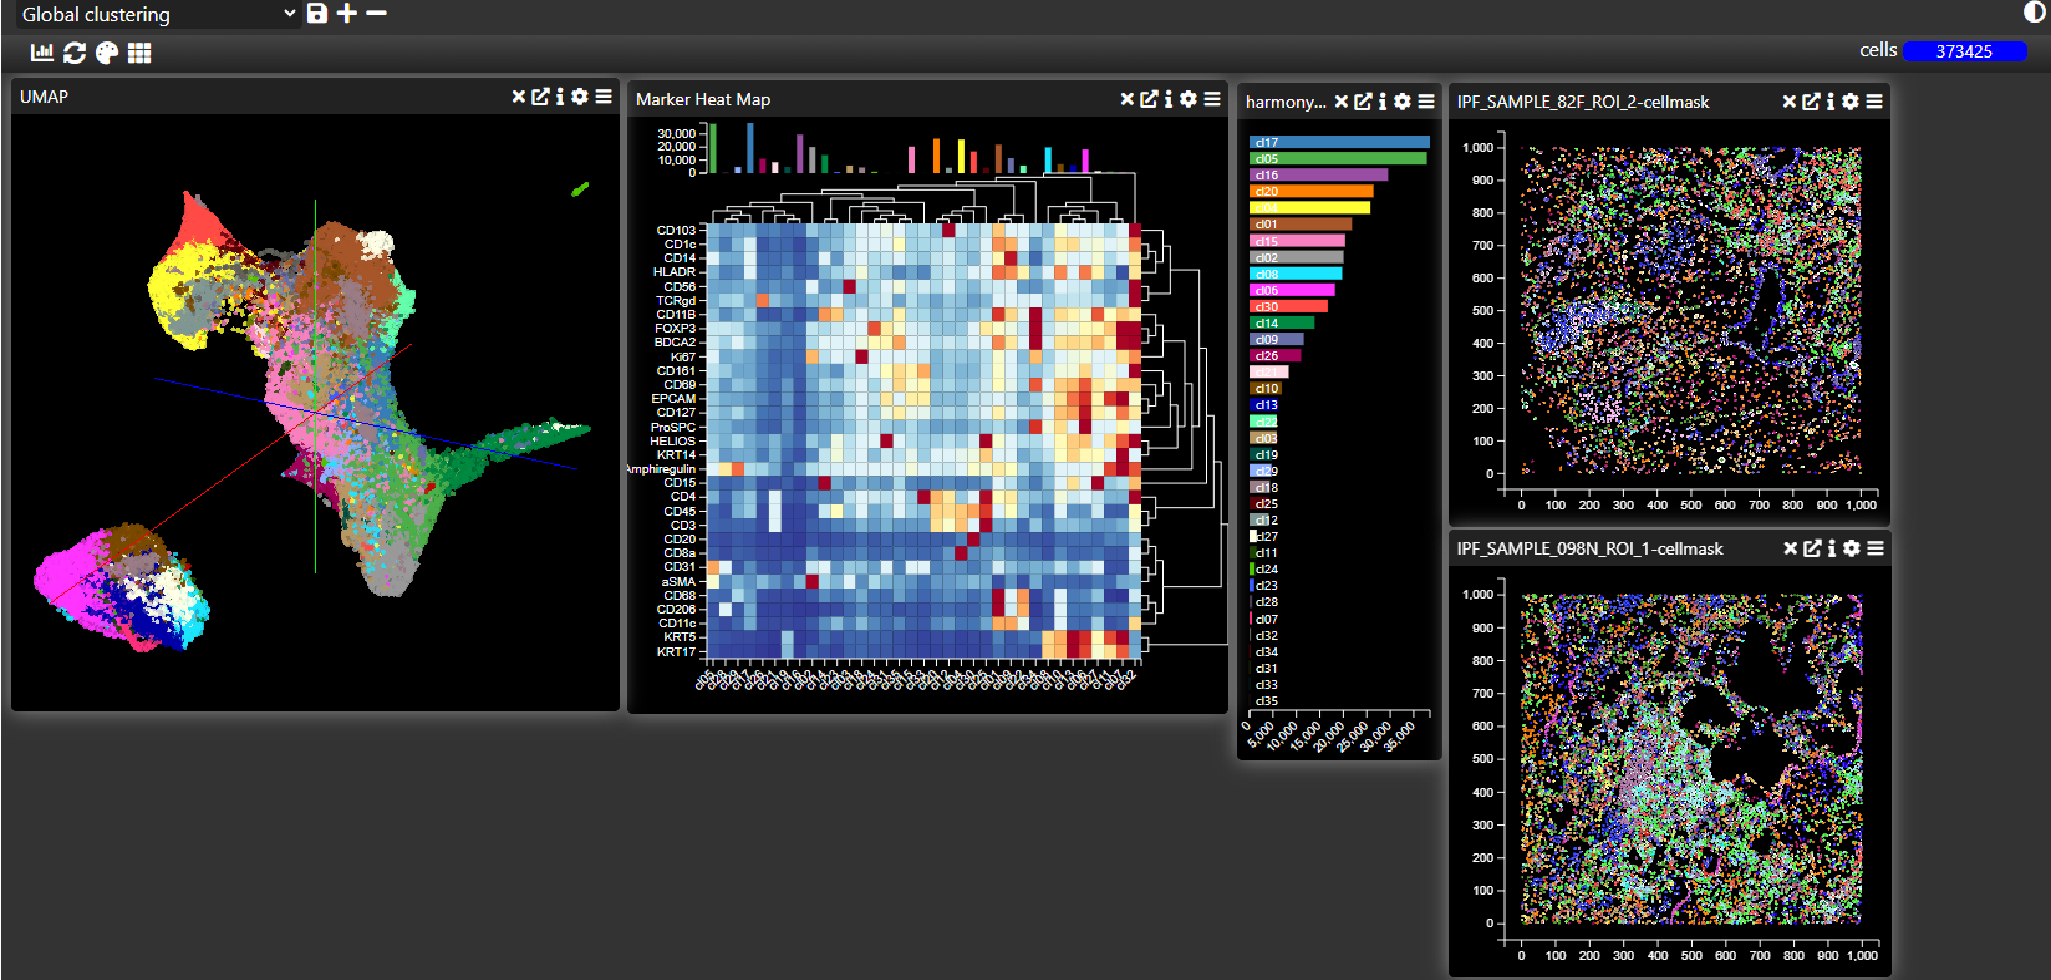
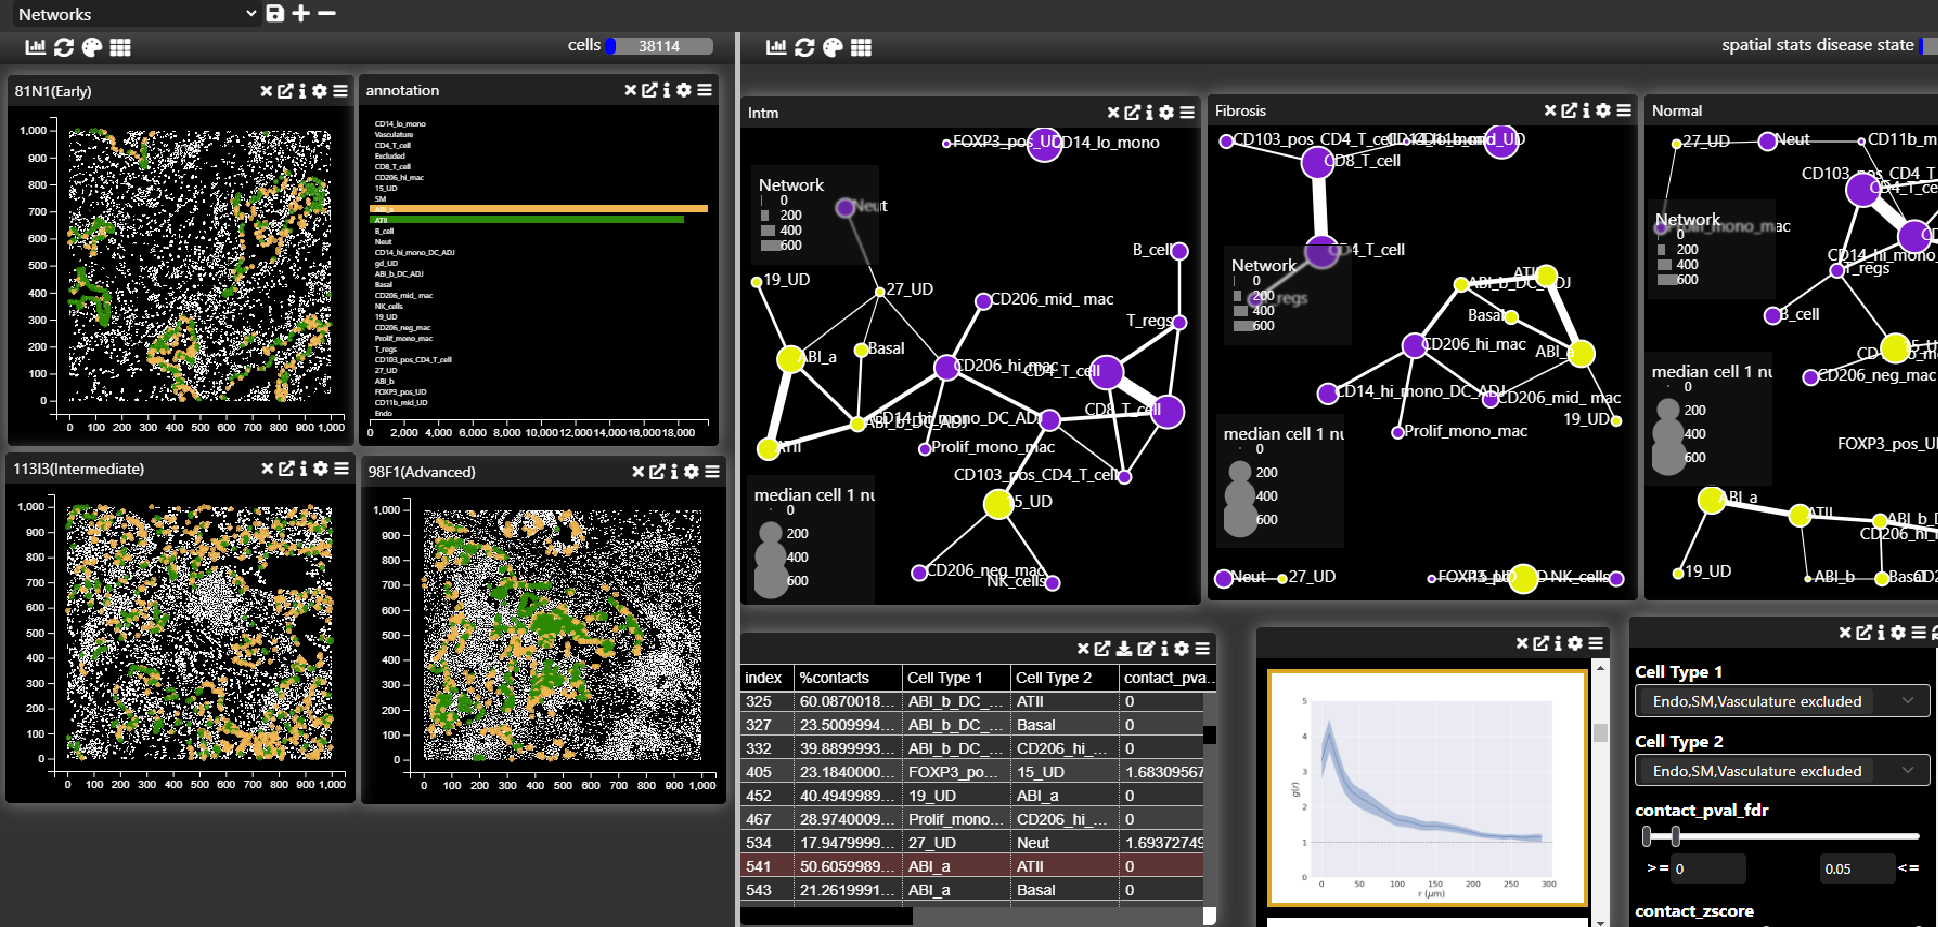
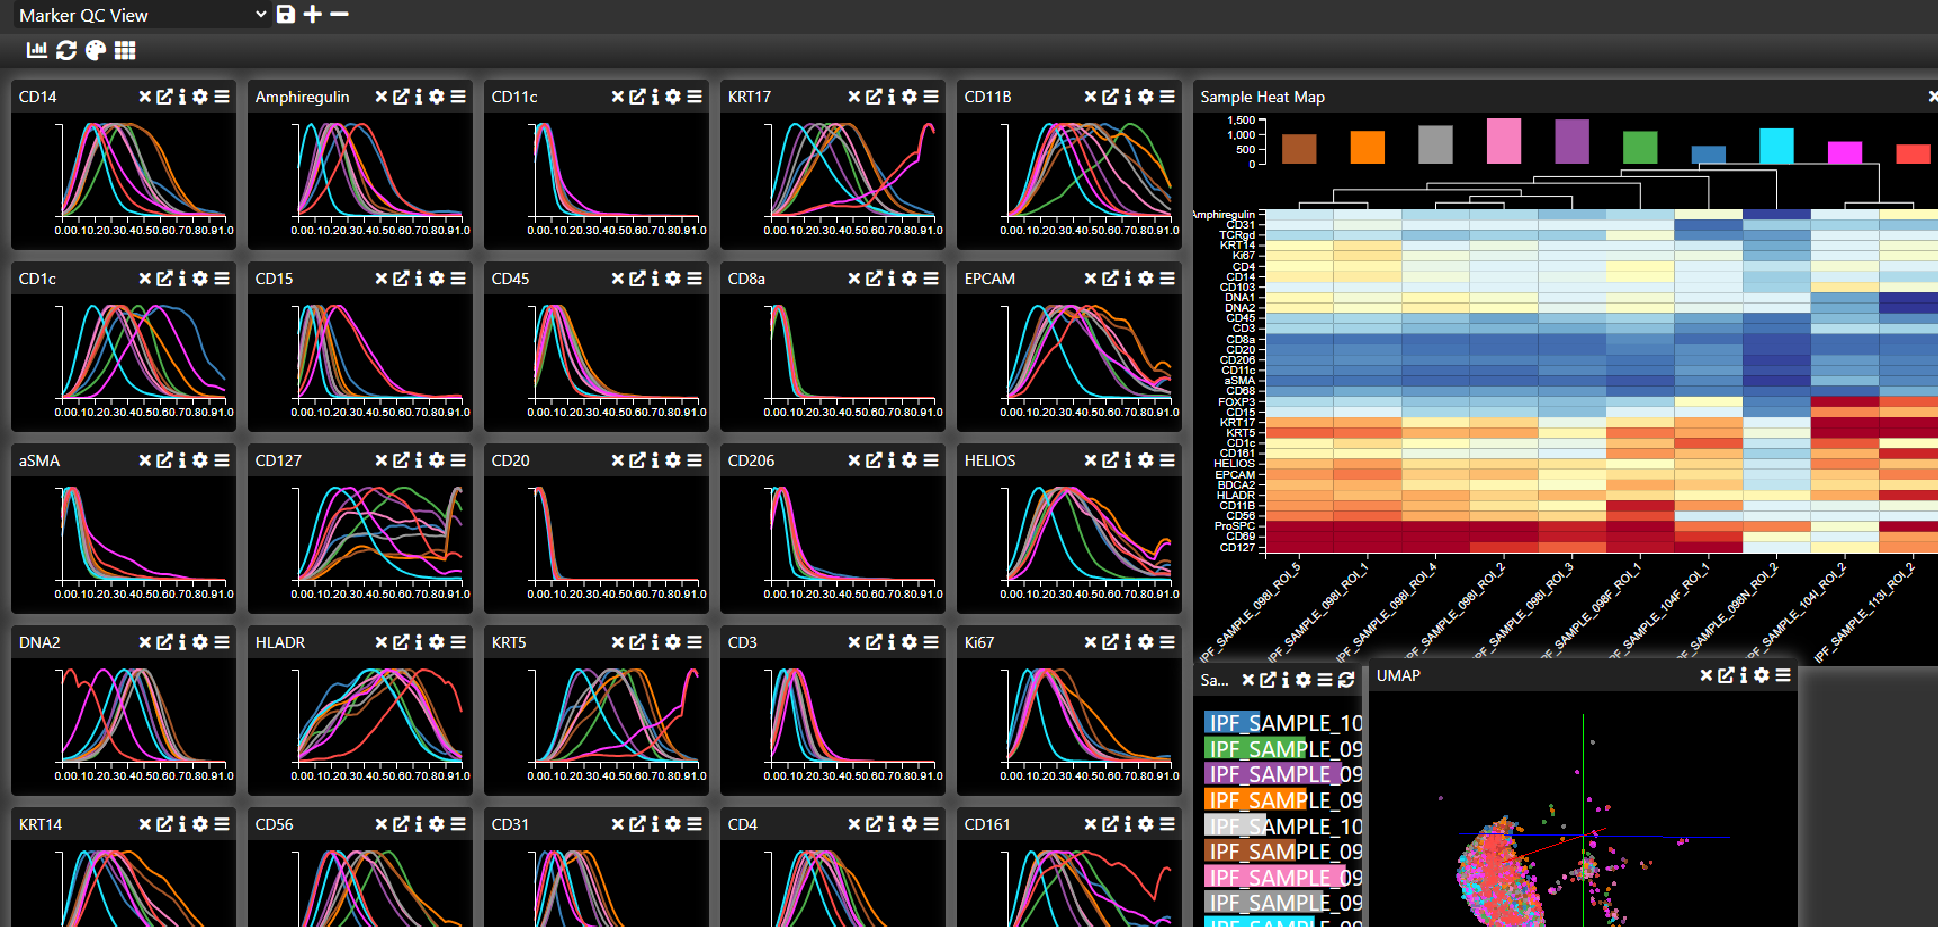
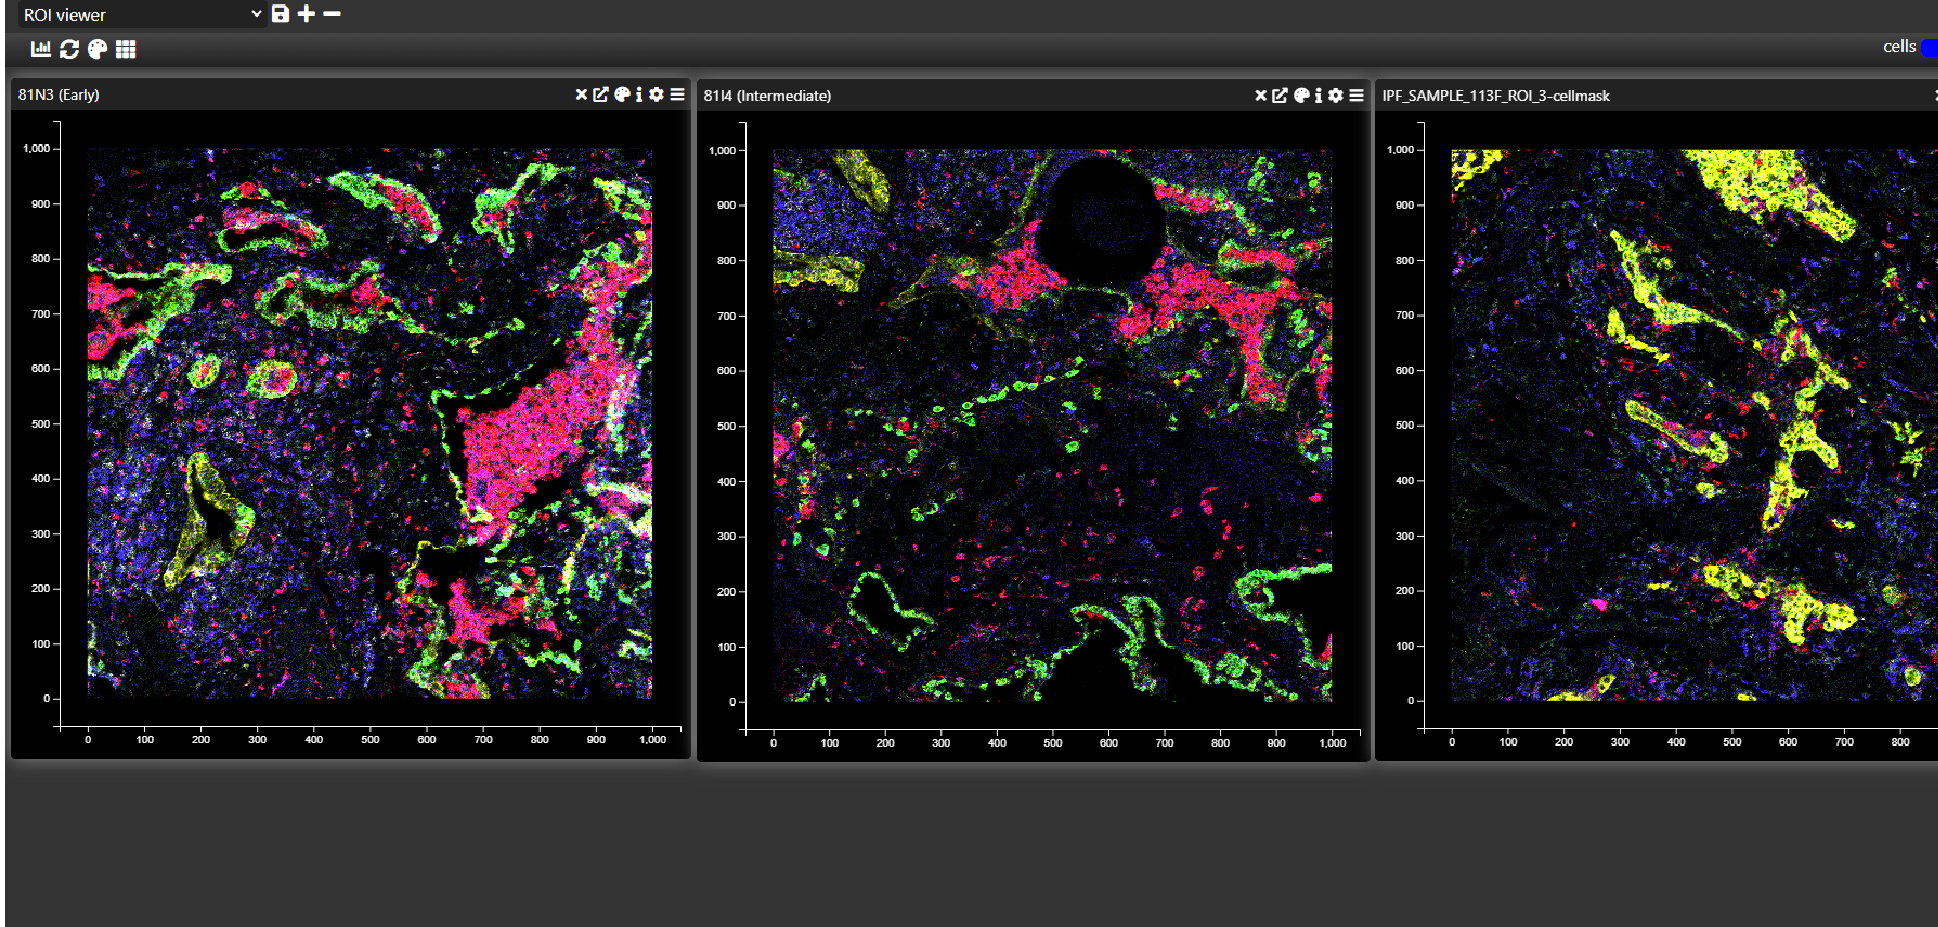
MDV helps researchers explore large, complex biological datasets including single-cell RNA-seq, spatial transcriptomics, proteomics, imaging, genomics and clinical metadata.
Reveal Biological Insight
Move beyond static figures. Interactively visualise millions of cells, observations and features to identify biological patterns, generate hypotheses and support publication-ready results.
Work With Oxford Experts
Use MDV as a platform or work with our team for bioinformatics support, data integration, custom visualisation, project dashboards and collaborative interpretation.
Built for Academic, Biotech and Pharma Research
Modern biomedical research generates complex multi-dimensional data that is difficult to interpret using static plots and fragmented workflows. MDV brings analysis, visualisation and collaboration into a single interactive environment, helping research teams move from raw or processed omics data to actionable biological insight faster.
Whether you are investigating cell states, tissue architecture, disease mechanisms, biomarkers, therapeutic targets or translational datasets, MDV can help you extract more value from your data.